
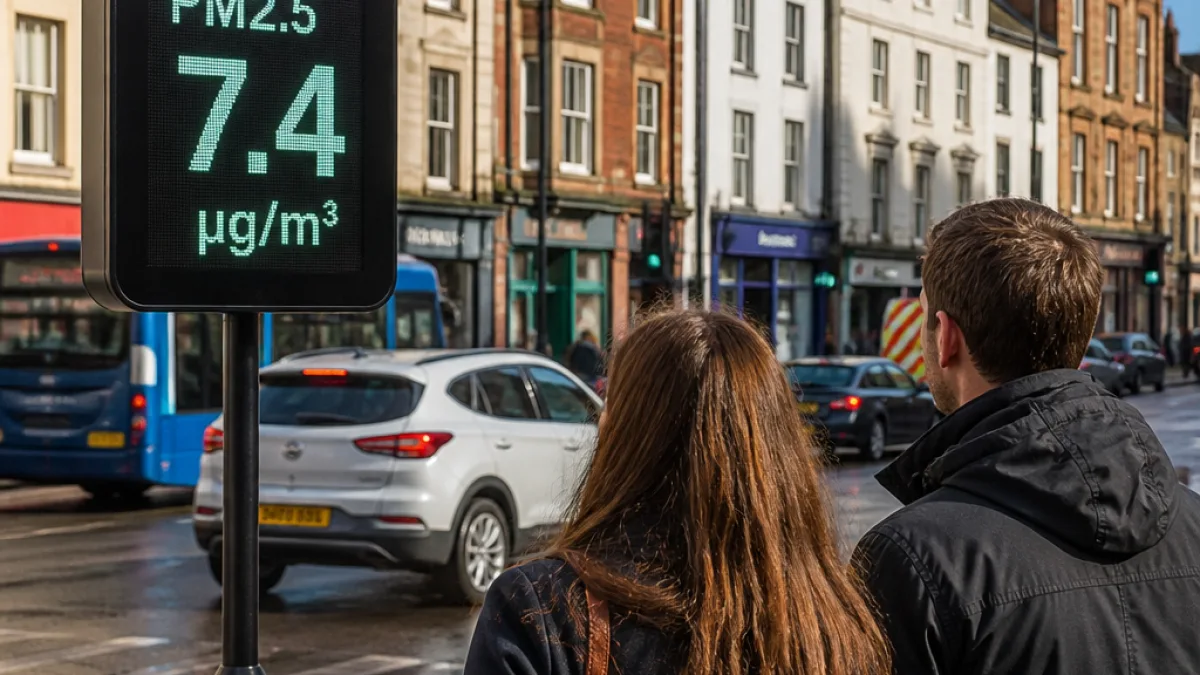
Dumfries town centre has recorded annual average levels of fine particulate matter that exceed the World Health Organization’s (WHO) recommended limit, according to data published by the Geographic Data Service. PM2.5 — microscopic particles produced mainly by combustion such as vehicle exhausts, brake and tyre wear, industrial processes and wildfires — measured an annual mean of 7.4 micrograms per cubic metre (µg/m³) in the town centre, higher than the WHO guideline of 5.0 µg/m³.
What the figures mean for local residents
PM2.5 particles are small enough to pass through the body’s natural defences and penetrate deep into the lungs and bloodstream. Health risks associated with exposure include irritation of the eyes and airways, increased susceptibility to respiratory infections, higher risks of lung cancer and long‑term impacts on cardiovascular health.
Alongside PM2.5, the data shows nitrogen dioxide (NO2) concentrations in Dumfries town centre averaged 4.2 µg/m³ annually — well below the WHO advisory of 15 µg/m³. Scientists stress, however, that no threshold is completely without risk and that even low levels of pollutants can have cumulative health effects.
How Dumfries compares with other urban areas
While the town centre reading breaches the WHO PM2.5 guideline, the levels in Dumfries are substantially lower than those recorded in many larger UK urban centres. For context, the Geographic Data Service highlighted that an area in Camden, London, registered an annual average of nearly 21 µg/m³ of PM2.5 and in excess of 34 µg/m³ of NO2 — among the highest in Britain.
| Location | PM2.5 (µg/m³) | NO2 (µg/m³) |
|---|---|---|
| Dumfries town centre | 7.4 | 4.2 |
| WHO recommended limit | 5.0 | 15 |
| Camden (example worst affected UK area) | ~21 | >34 |
"The World Health Organisation recommends levels should not exceed an annual average of five micrograms of PM2.5 and 15 micrograms of NO2."
Local implications and the wider picture
The Geographic Data Service’s findings echo a national pattern: urban areas across Britain frequently show PM2.5 concentrations above the WHO guideline. The dataset noted that 99% of neighbourhoods in Britain exceeded the recommended PM2.5 level and around 51% of areas had NO2 above the WHO recommendation. Urban settings bear the brunt of this burden, with road transport and combustion processes the primary contributors.
For Dumfries, the immediate policy questions are familiar to many Scottish towns: how to reduce traffic‑related emissions in the centre, whether to accelerate measures to encourage active travel and public transport, and how to control emissions from any local industrial sources. The lower NO2 figure suggests road‑traffic diesel exhaust — a principal source of NO2 — is not producing the levels seen in larger cities, but PM2.5 can originate from a wider array of combustion activities including domestic heating, small industry and regional pollution transport.
- PM2.5 in Dumfries town centre: 7.4 µg/m³ (annual average)
- WHO guideline for PM2.5: 5.0 µg/m³
- NO2 in Dumfries town centre: 4.2 µg/m³ (annual average)
Public health officials and local councils typically respond to such data by reviewing local air‑quality action plans and monitoring strategies. For residents, practical steps to reduce exposure include avoiding heavy traffic routes on foot or bicycle at peak times, choosing indoor activities when particulate concentrations are elevated, and supporting local measures that reduce combustion emissions.
While the Dumfries readings are far lower than the worst affected urban neighbourhoods, the breach of the WHO PM2.5 guideline is a reminder that air quality remains a local health concern. Continued monitoring and targeted mitigation will be needed if the town is to meet international recommendations and protect the most vulnerable members of the community.